Spreadsheets for the real work.
Dazr Sheets runs in your browser, with nearly 500 functions, pivot tables, charts and conditional formatting. Your workbooks save to Dazr Files as you work.
Free with your Dazr account.
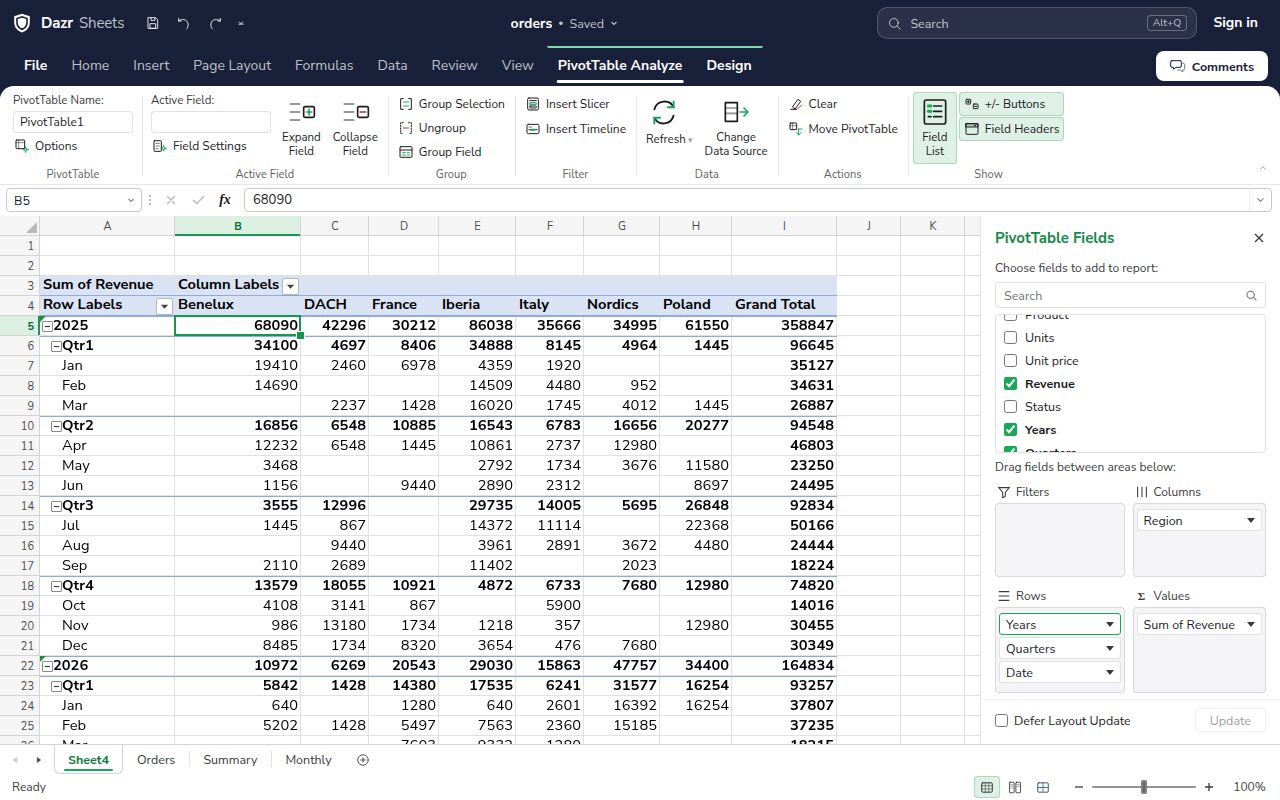
Pivot tables, done properly.
Summarise thousands of rows without writing a formula.
Tick the fields you need and drag them between rows, columns, values and filters. The table updates as you go.
Add a date and it is grouped into years, quarters and months. Expand or collapse each level with one click.
The results are ordinary cells, so formulas and charts can use them. Refresh when the source data changes.
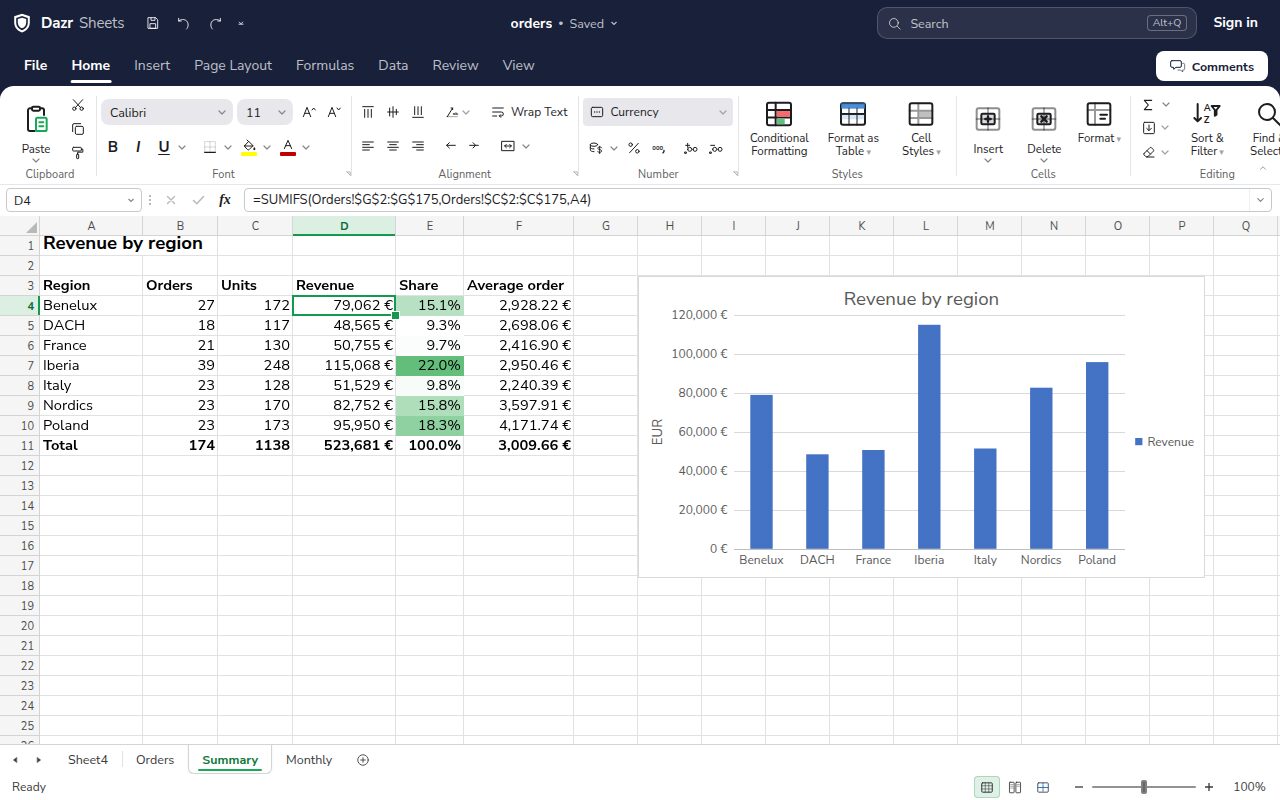
Formulas you know, charts that keep up.
Everything recalculates the moment a number changes.
From SUM and SUMIFS to XLOOKUP, dynamic arrays and LAMBDA, with help for every argument as you type.
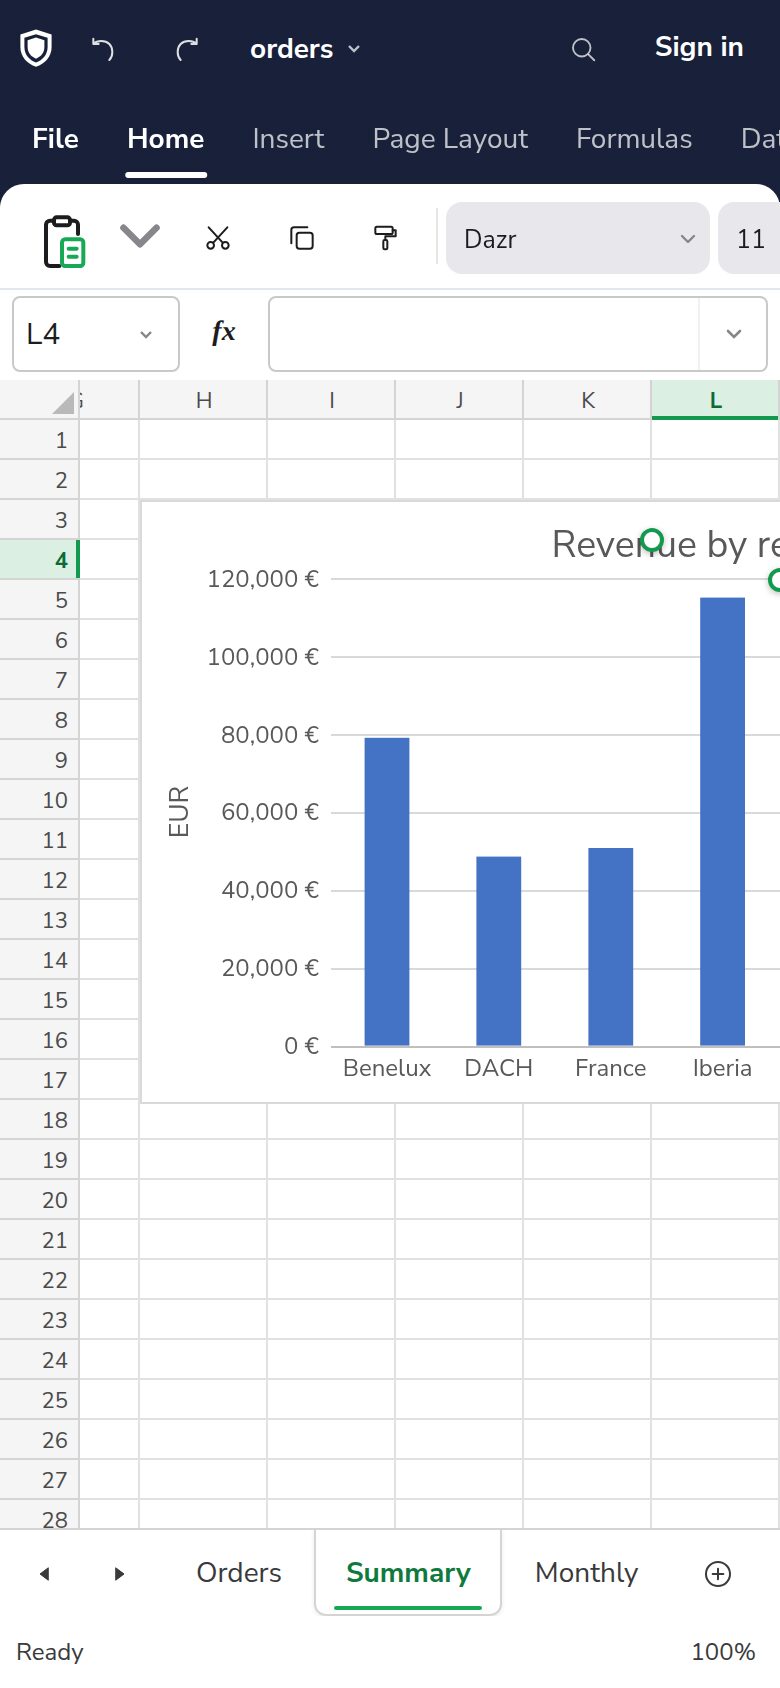
Column, line, pie and more, placed next to your data and updated with it.
Data bars, colour scales and rules that highlight what needs attention.
Clean data in, clear answers out.
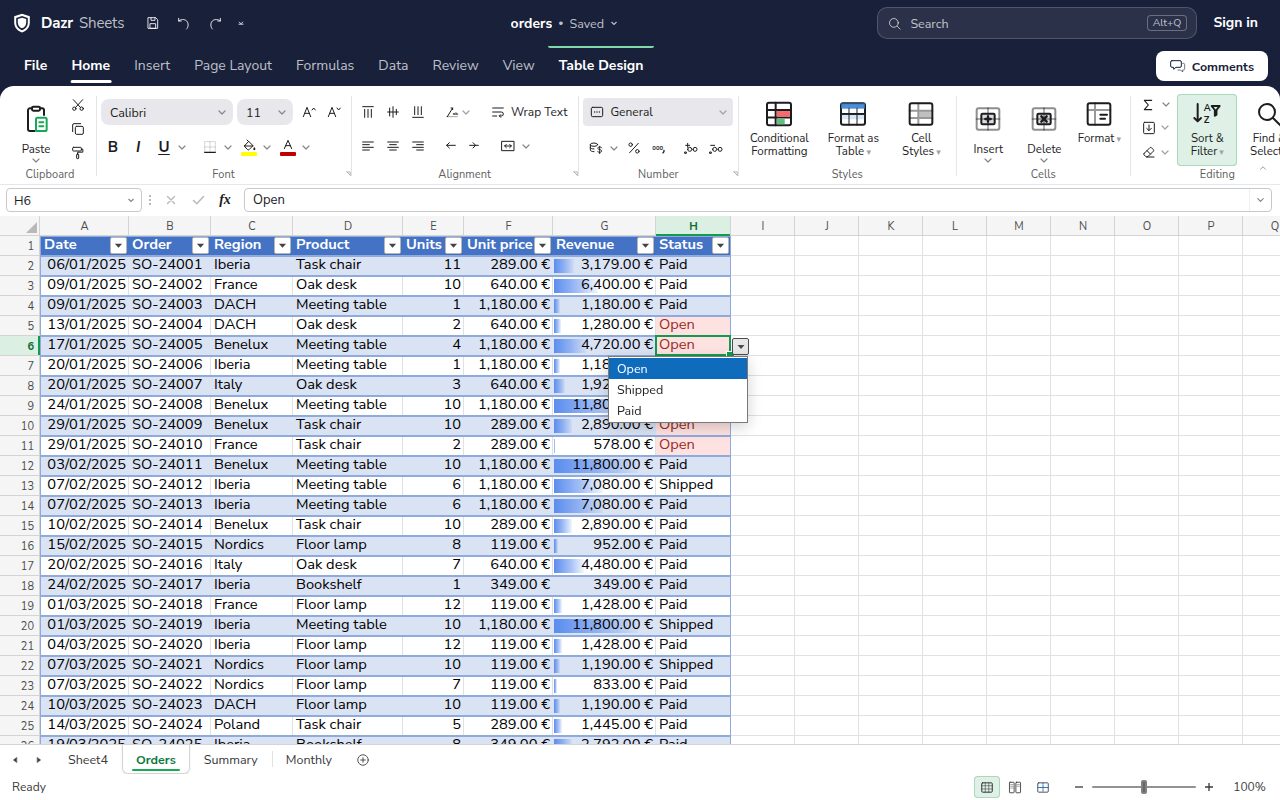
Keep lists tidy so the totals stay right.
Limit a column to the values you allow and pick them from a list.
Turn a range into a table with banded rows, filters and sorting.
Ask a question on a cell and keep the discussion next to the numbers.
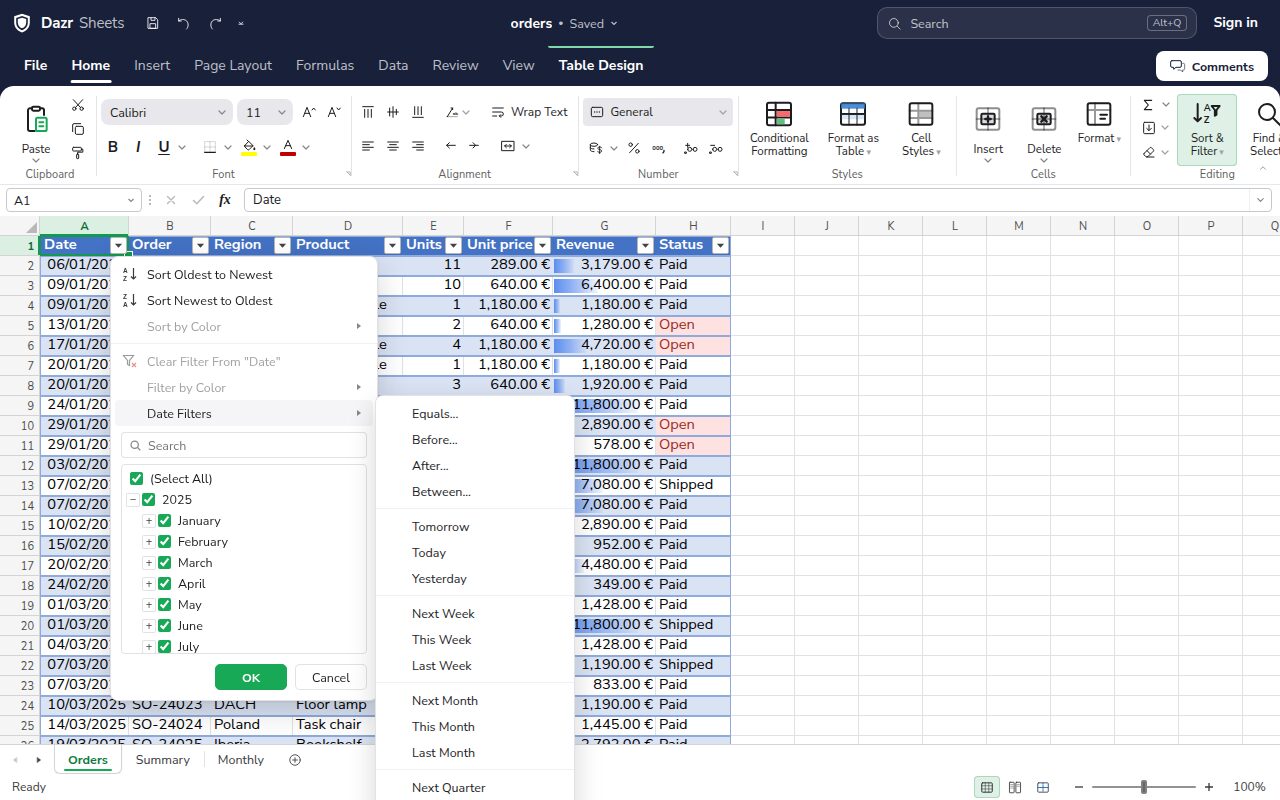
Filter to the rows you need.
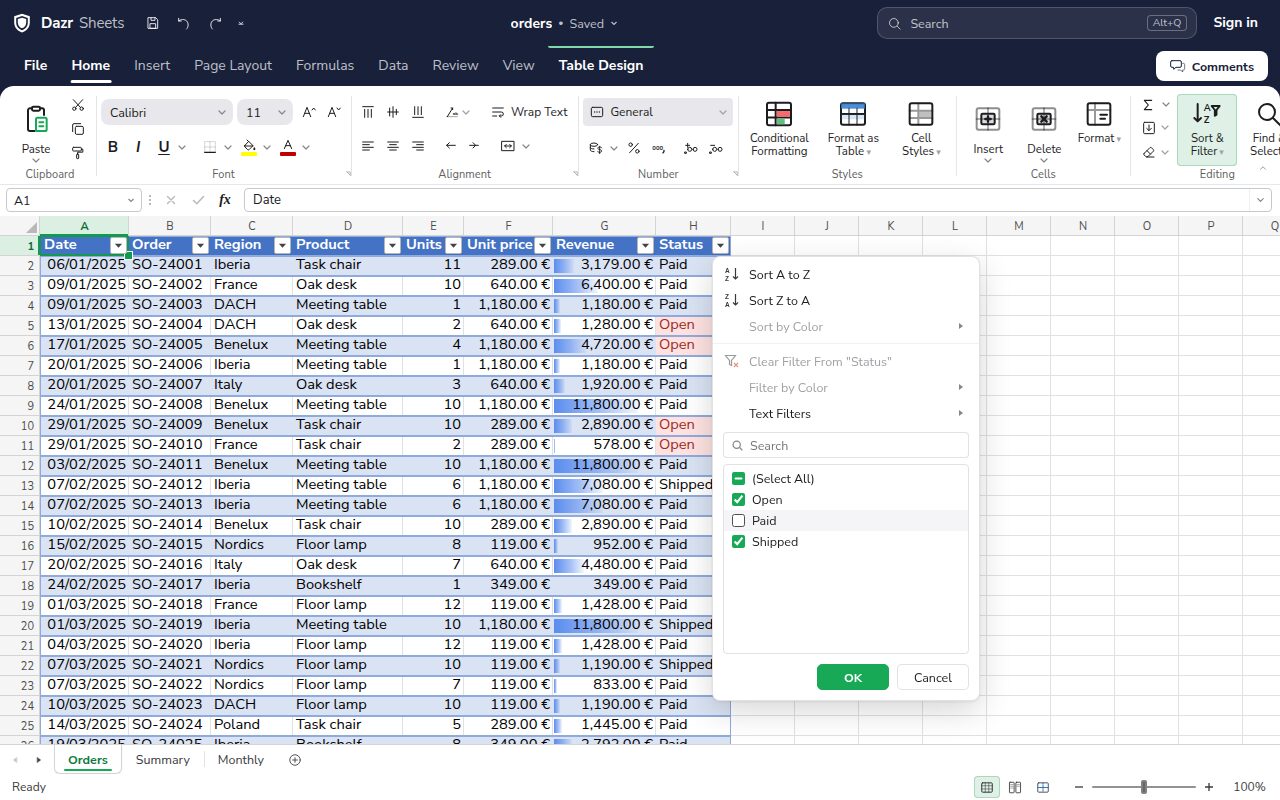
Find the records that matter in a long list.
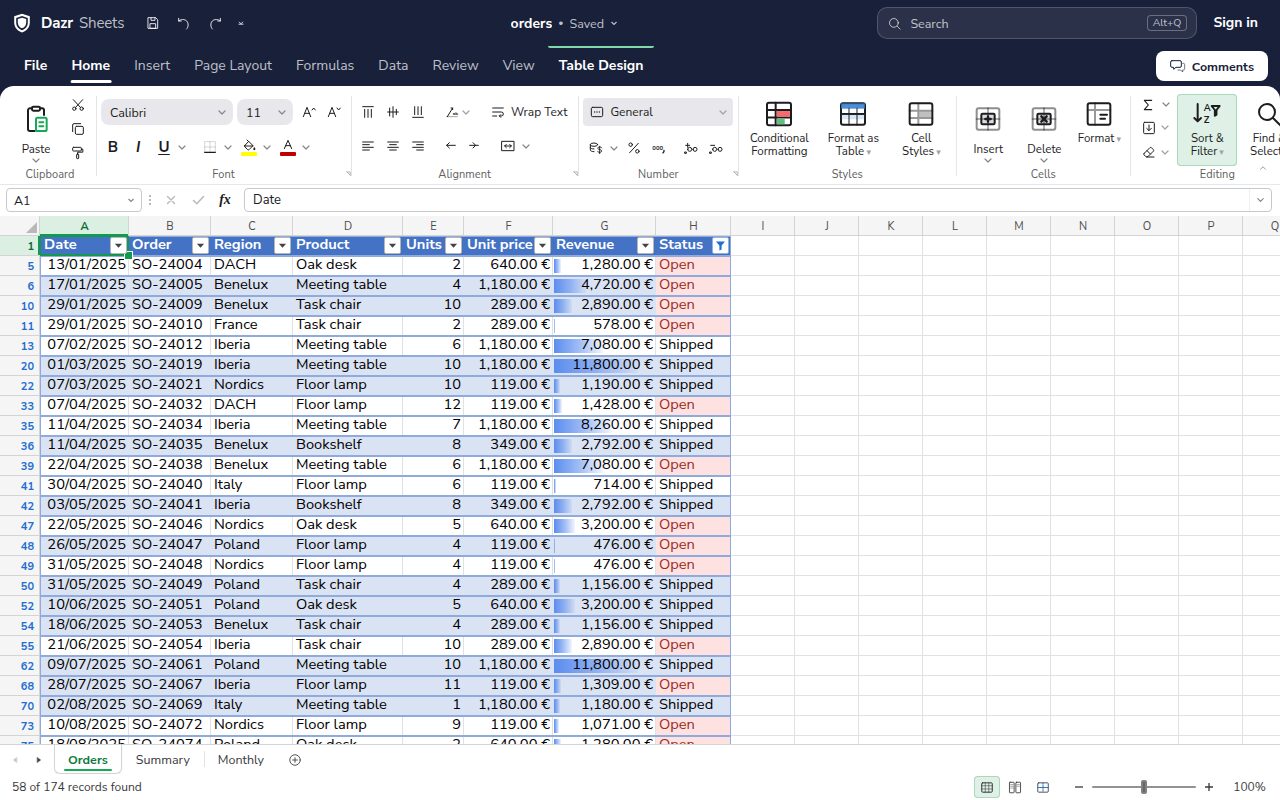
Tick the values to keep, or search the list to find one quickly.
Pick years and months, or choose This month, Last quarter and more.
Filtered row numbers turn blue, and the status bar says how many records were found.
Your workbooks, intact.
Open the files you already have and save them in the format you need.
Formulas, number formats, tables, charts, conditional formatting, data validation and named ranges come through in .xlsx. Workbooks with macros keep them when you save.
Pivot tables open and save as pivot tables, with their date grouping by years, quarters and months.
In .ods, charts, conditional formatting, validation, named ranges, number formats and tables with their filters come through, both ways.
Excel 97-2003 workbooks open with their formulas, dates, formatting and named ranges. Save them as .xlsx to keep working.
Open and save .csv and .tsv files in UTF-8, with dates in ISO format.
Export the active sheet or the whole workbook as a PDF, or every sheet as one web page.
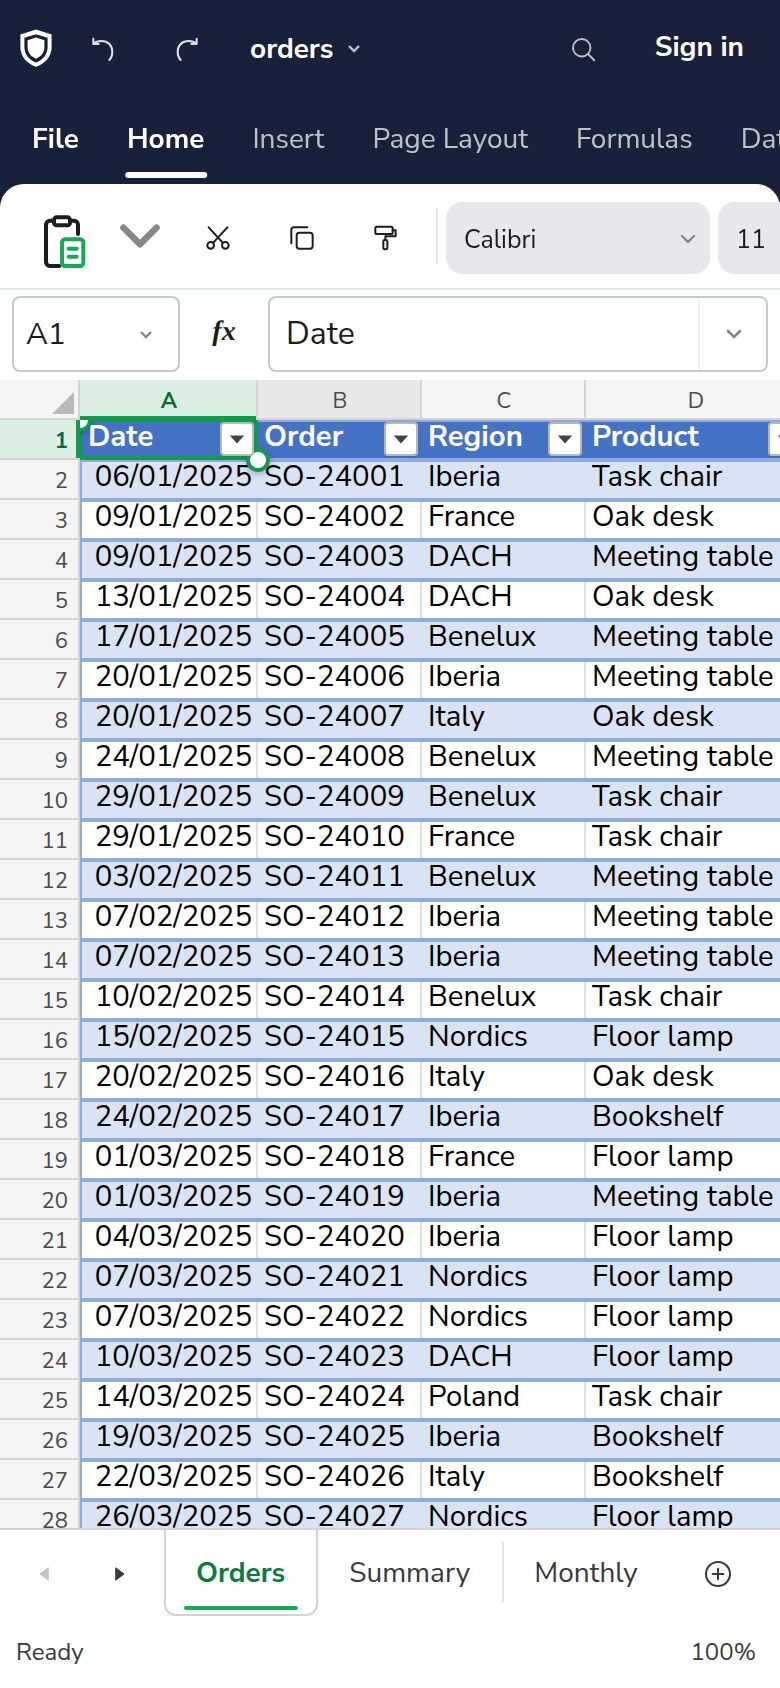
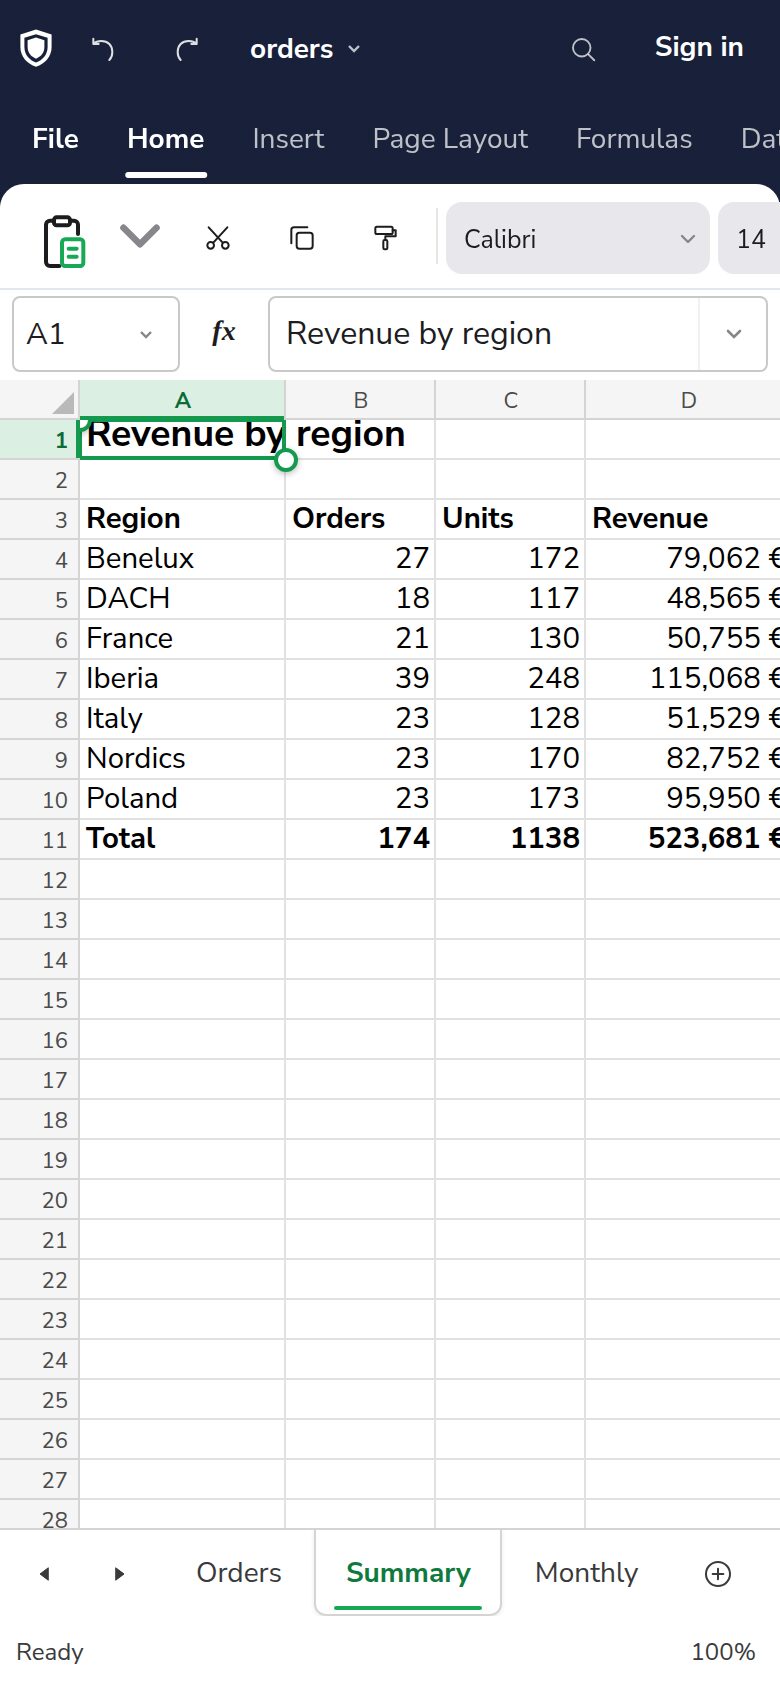
Runs in Chrome, Edge, Firefox and other modern browsers, with a layout made for phones.
On your phone, saved as you go.
Pick up where you left off, on any device.
Signed in, every change is saved to Dazr Files, and the last 10 versions are kept.
Dazr Files keeps your workbooks encrypted on European infrastructure, run by an Italian company.
Put a file in your organisation’s shared space and everyone in it can open it.
Open your first workbook.
Sign in with your Dazr account and start with a blank workbook or a template.